Chart Analysis
BeeCount provides multiple chart types to visually display financial data.
Line Charts
Show income and expense trends:
- Daily View - Daily amounts
- Weekly View - Weekly summaries
- Monthly View - Monthly summaries
Great for discovering spending patterns and unusual expenses.
Pie Charts
Show category proportions:
- Visual display of each category's share
- Tap a sector to view details
- Switch between income/expense
Great for understanding spending structure.
Category Details
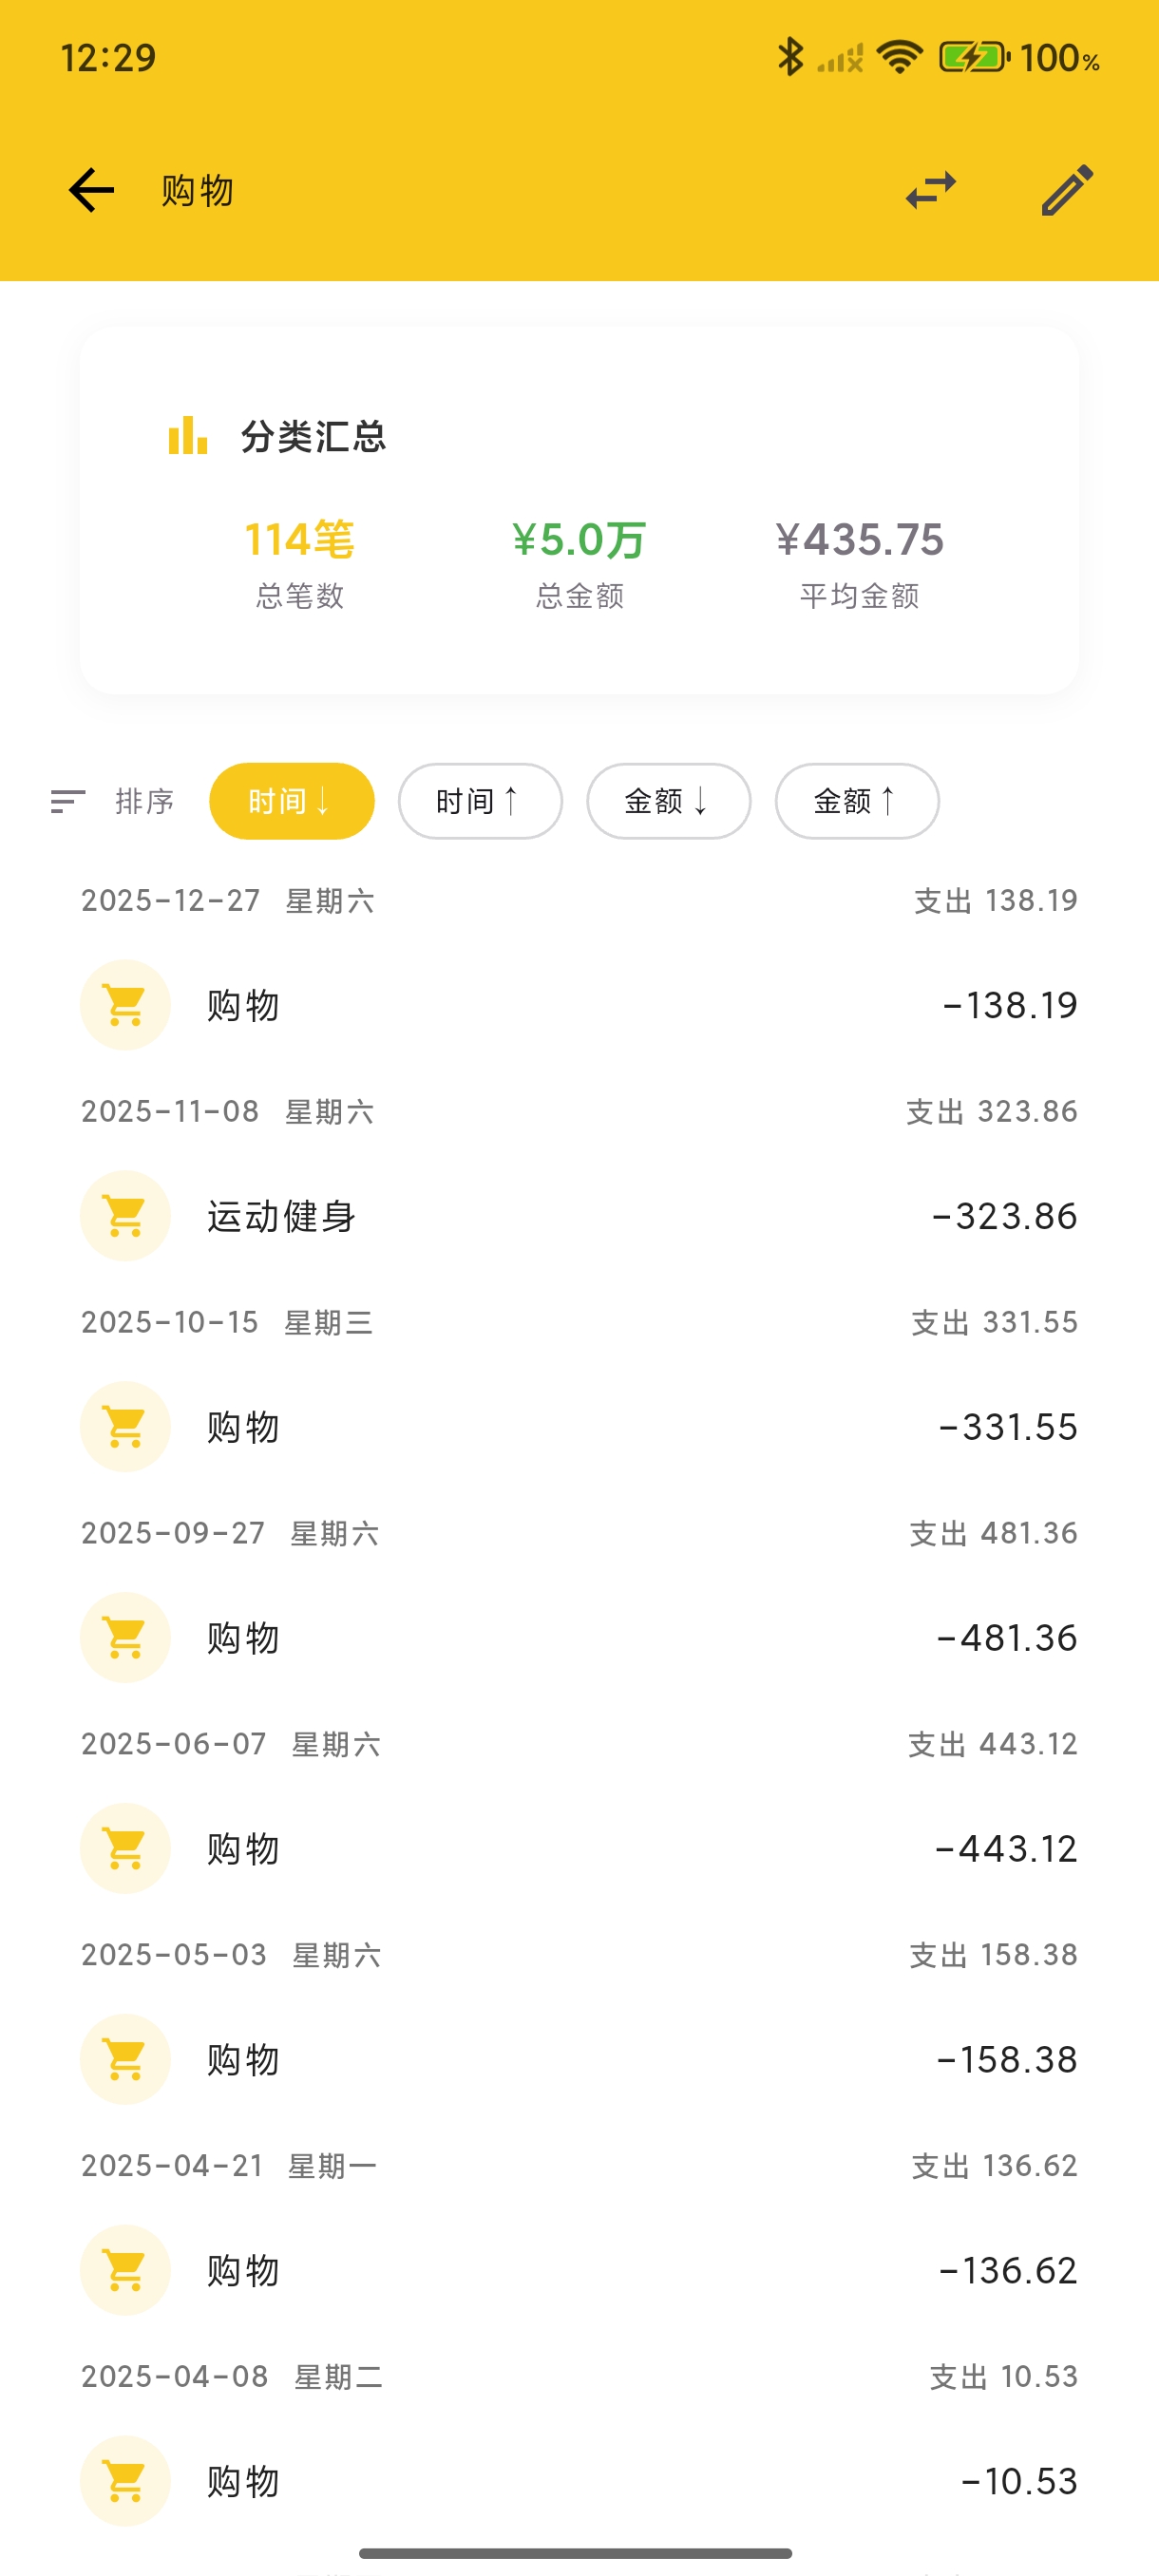
Tap a category to view:
- Total amount for that category
- Percentage of total expenses
- Related transaction list
Data Comparison
- Compare with previous month
- Month-over-month growth rate
- Year-over-year analysis